Choosing a coverage factor
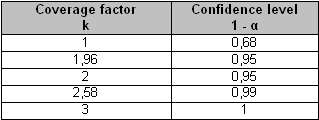
If the measurement results are distributed according to a normal law around the average value m (cf. figure 1), table 3 shows the respective values of the coverage factor k and the confidence level
 sont rassemblées dans le tableau 3.

![[zoom...]](javascript:window.open(%22../res/figure_01_1.jpg%22,%22_blank%22,%22width=%22+Math.min(800,screen.availWidth)+%22,height=%22+Math.min(600,screen.availWidth)+%22,left=%22+(screen.availWidth-800)/2+%22,top=%22+(screen.availHeight-600)/2+%22,scrollbars=yes,resizable=yes%22)?void(0):void(0))
![[zoom...]](javascript:window.open(%22../res/tablo_03_1.png%22,%22_blank%22,%22width=%22+Math.min(800,screen.availWidth)+%22,height=%22+Math.min(600,screen.availWidth)+%22,left=%22+(screen.availWidth-800)/2+%22,top=%22+(screen.availHeight-600)/2+%22,scrollbars=yes,resizable=yes%22)?void(0):void(0))
These values are only strictly valid when the number N of replications of measurements is high (typically N≥30). This is rarely the case in practice, and we must therefore use Student's t-distribution followed by the variable
 is the arithmetic mean of N independent observations xk ofx and
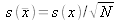 is the experimental standard deviation of the average
 . Note that Student's t-distribution is only valid if the random variable x follows a normal law of mathematical expectation µx and of standard deviation
 .
.
As a consequence, if the measurand Y is a single quantity X following a normal law, such as Y=X and if X is estimated by the arithmetic mean
 of N independent replicate observations Xk of X, with an experimental standard deviation of the average
 , then
 is distributed according to Student's t-distribution with
that is to say
or
In these expressions,
 is the value of t for a given value of the parameter ν (number of degrees of freedom) such as the interval
 is associated with a confidence level
. In other words, the expanded uncertainty is
is associated with a confidence level
. In other words, the expanded uncertainty is