Spectrometry by Fourier transform
Spectrometry by Fourier transform is one of the interferometers uses. The spectrometry is the radiation spectrum measurement. As we have observed before in “Interferences: Fundamentals”, the light source coherence, thus its spectrum, has a major influence on the interferogram observed when we modify the difference of optical path varies. Spectrometry by Fourier transform is a direct application of Wiener-Kinchine theorem. According to “Interferences: Fundamentals”, the interferogram is written
where
 is the Fourier transform of source energy spectral density,
 , and
, and
 is value
for
is value
for
 .
.
It is also possible to write the interferogram as
reverse Fourier transform
 becomes
Fourier transform is a trimodal function where
 part is proportional to the source spectrum. We are used to recording the interferogram on a total course difference
 and the signal is digitalized on
 sampling spots, then we calculate the spectrum with a discrete Fourier transform (FFT algorithm). With this technique, the obtainable spectral resolution depends on a discrete Fourier transform filtration function.
Let us write this function
 , we have [6]:
Function
is the line function in the spectrum calculated by FFT. The line function width is given by
 . Thus the spectrometer resolution power is given by
Therefore the resolution power depends on the relation between the recorded difference of optical path and the average wavelength of the source: it is equal to the recorded number of fringes.
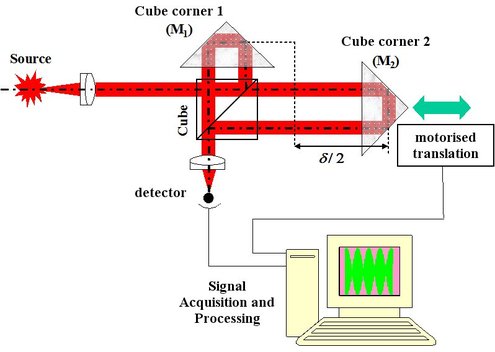
An experimental device explaining that technique is described on Figure 40.
![[zoom...]](javascript:window.open(%22../res/Fig_40_2.jpg%22,%22_blank%22,%22width=%22+Math.min(800,screen.availWidth)+%22,height=%22+Math.min(600,screen.availWidth)+%22,left=%22+(screen.availWidth-800)/2+%22,top=%22+(screen.availHeight-600)/2+%22,scrollbars=yes,resizable=yes%22)?void(0):void(0))
Michelson classical plane mirrors are replaced by two cube corners that have the particularity to reflect the light in the opposite direction. Cube corner no 2 is assembled on a computer driven translation plate. For a
 cube move, we make a
 difference in the optical path. Thanks to the cube corners used there is no need to realign the mirror-cube after each translation. The signal acquisition by the detector is computer driven in a synchronic way with the cube translation.
As an illustration, Figure 41 shows the interferogram obtained with a sodium based low pressure lamp.

![[zoom...]](javascript:window.open(%22../res/Fig_41_2.jpg%22,%22_blank%22,%22width=%22+Math.min(800,screen.availWidth)+%22,height=%22+Math.min(600,screen.availWidth)+%22,left=%22+(screen.availWidth-800)/2+%22,top=%22+(screen.availHeight-600)/2+%22,scrollbars=yes,resizable=yes%22)?void(0):void(0))
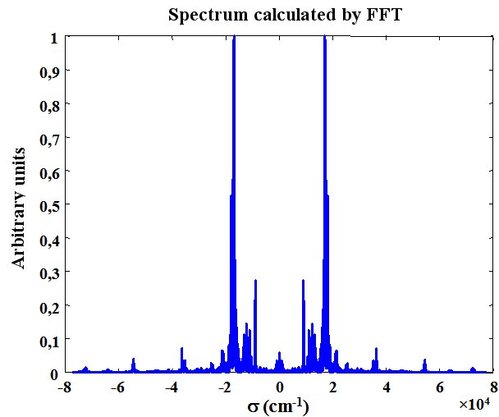
The spectrum FFT calculation gives Figure 42 results. We can observe the spectrum symmetry.
![[zoom...]](javascript:window.open(%22../res/Fig_42_2.jpg%22,%22_blank%22,%22width=%22+Math.min(800,screen.availWidth)+%22,height=%22+Math.min(600,screen.availWidth)+%22,left=%22+(screen.availWidth-800)/2+%22,top=%22+(screen.availHeight-600)/2+%22,scrollbars=yes,resizable=yes%22)?void(0):void(0))
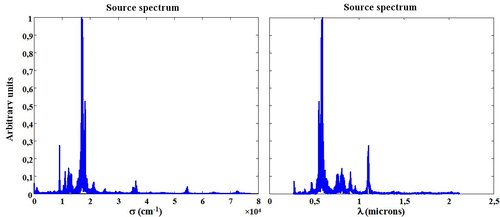
After the extraction of the positive waves numbers part, the source spectrum as a function of the wavelength is given in Figure 43.
![[zoom...]](javascript:window.open(%22../res/Fig_43_2.jpg%22,%22_blank%22,%22width=%22+Math.min(800,screen.availWidth)+%22,height=%22+Math.min(600,screen.availWidth)+%22,left=%22+(screen.availWidth-800)/2+%22,top=%22+(screen.availHeight-600)/2+%22,scrollbars=yes,resizable=yes%22)?void(0):void(0))
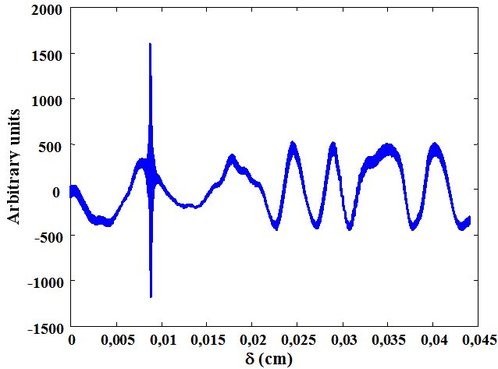
There is a second illustration, with an incandescent lamp this time, whose measured interferogram is given in Figure 44.
![[zoom...]](javascript:window.open(%22../res/Fig_44_2.jpg%22,%22_blank%22,%22width=%22+Math.min(800,screen.availWidth)+%22,height=%22+Math.min(600,screen.availWidth)+%22,left=%22+(screen.availWidth-800)/2+%22,top=%22+(screen.availHeight-600)/2+%22,scrollbars=yes,resizable=yes%22)?void(0):void(0))
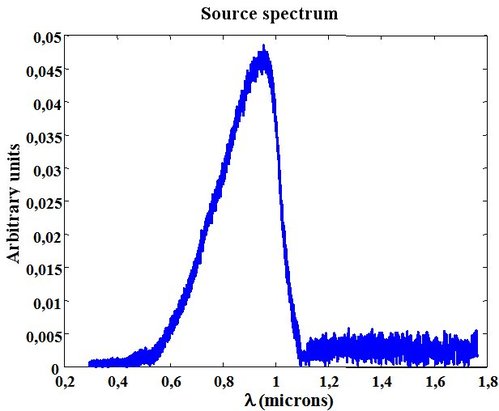
After computing, the source spectrum as a function of the wavelength is represented on figure 45.
![[zoom...]](javascript:window.open(%22../res/Fig_45_2.jpg%22,%22_blank%22,%22width=%22+Math.min(800,screen.availWidth)+%22,height=%22+Math.min(600,screen.availWidth)+%22,left=%22+(screen.availWidth-800)/2+%22,top=%22+(screen.availHeight-600)/2+%22,scrollbars=yes,resizable=yes%22)?void(0):void(0))
The later result needs a comment about the spectrum observation as a function of the wavelength. The incandescent lamp is a black field-type source whose spectral band is very wide and covers from the UV ray to the IR. But the Figure 45 result shows that the spectrum is suddenly lessened around
 . That is due to the sensitivity spectral band of the silicon-based detector that cuts at that wavelength and that is used in the Figure 40 device. Thus we can observe that the measured spectrum is influenced by the sensor spectrum sensitivity. It is important to correct the measurement and to process the spectrum dividing it by the sensor sensitivity for all the measurable wavelengths. This process has not been applied for the results shown in that case study.